Showing posts with label Stats. Show all posts

Tuesday, 5 May 2015

LearnUCS Stats: April 2015

Application Insight

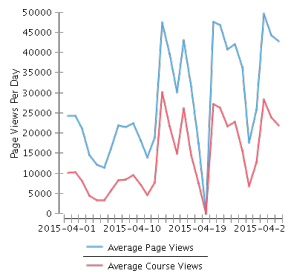
Total Page Views1,255,934
Average Page Views Per DayNon course - 29,070

Course - 14,237
Most Active DateNon Course - 49,611- 28 April 2015

Course - 30,740 - 14 April 2015


Application Metrics


Total Monthly Logins35,470
Total Number of Courses9780
Total Number of Active Courses1765

We have had continued fall in the number of active module this month, this follows the trend of the end of semester 1, with staff and students no longer requiring access to those materials.


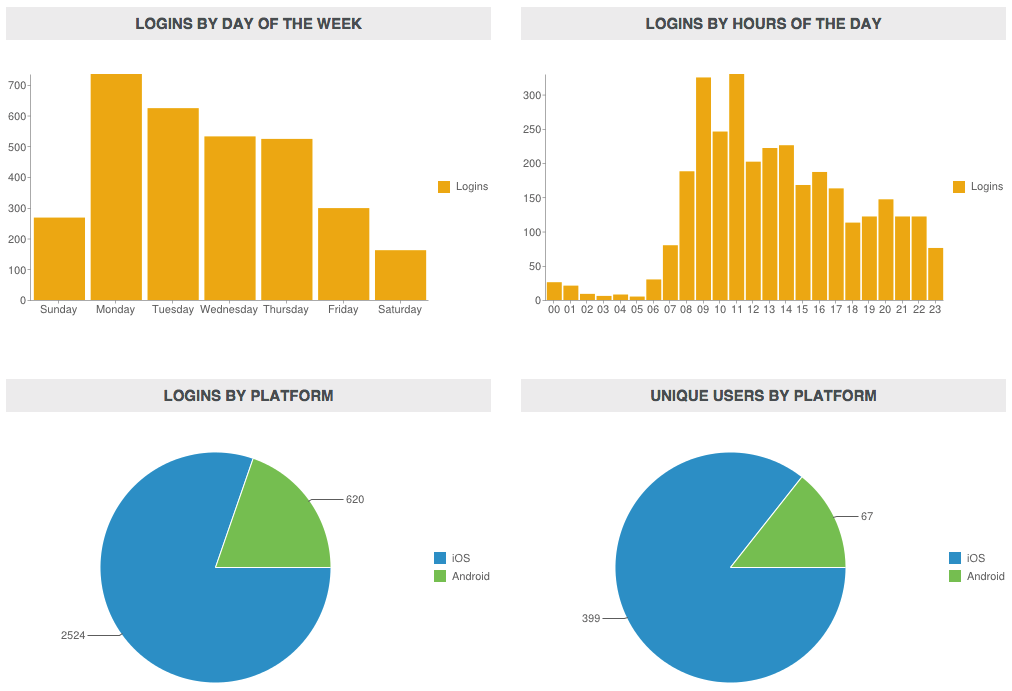
LearnUCS Mobile Statistics for 6 April 2015 to 5th May 2015

The stats below are use the built-in Blackboard mobile analytics, which uses the mobile service for the mobile application for its data.

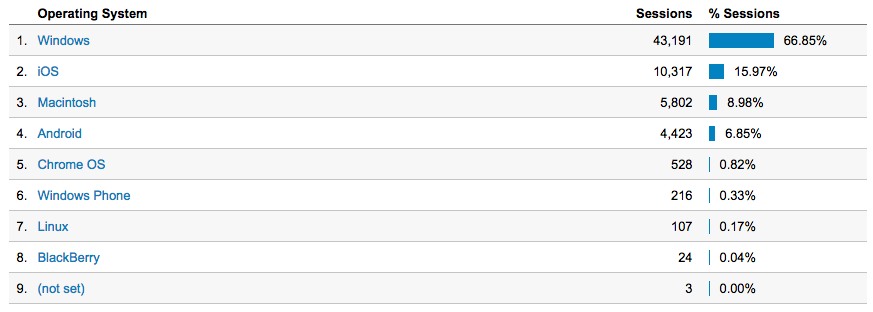
Since April we have been using Google Analytics on our Blackboard installation, this does not take into account those users using the mobile app. An interesting stats that Google shows us is that the second most used operating system of those accessing the web platform is iOS, a mobile operating system with 15.97% of all access.

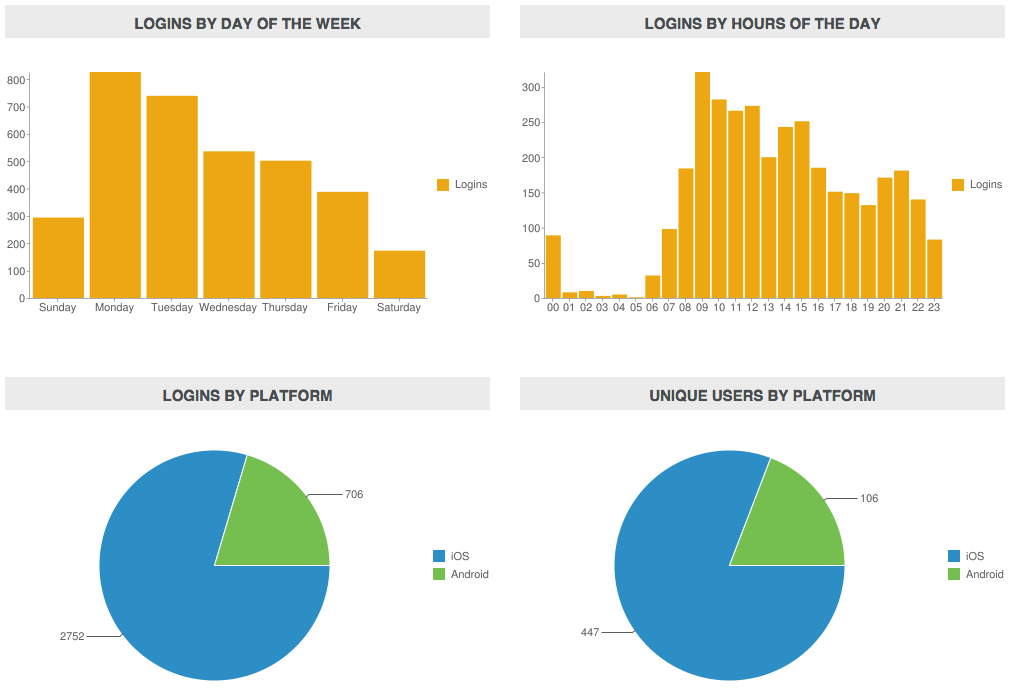
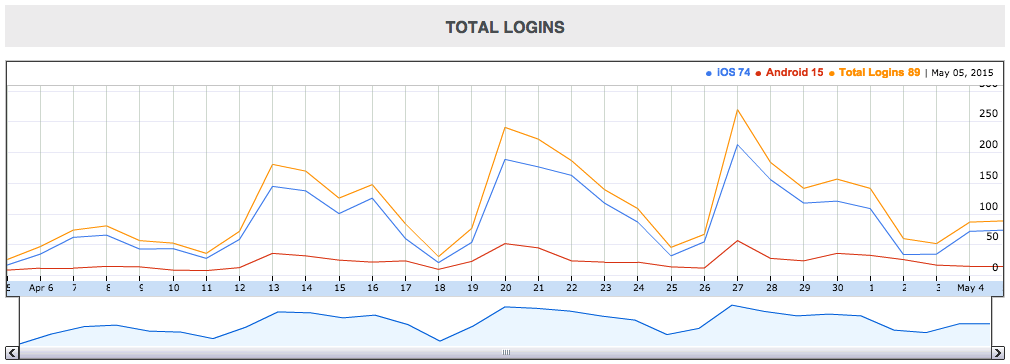
These stats below are for the Mobile Learn application only.

Total unique logins for the period was 553 with 3,458 logins.
iOS is still the most popular operating system for those devices by far.


Monday, 9 March 2015

LearnUCS Stats: February 2015

Application Insight

Below is the continuation of the publishing of monthly statistics for LearnUCS. These stats cover the period from February 6th 2015 to March 5th 2015.

Comparing these numbers to last month we have had a very small dip, this, we believe is due to these stats being the month after the start of a new semester, with the initial flurry of both staff and students accessing the newly released modules.

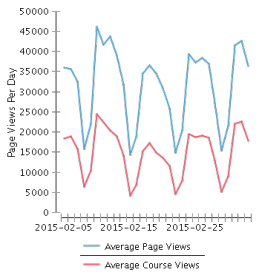
Total Page Views1,342,625
Average Page Views Per DayNon course - 31,452

Course - 15,362
Most Active DateNon Course - 45,988- 10 February 2015

Course - 24,451 - 10 February 2015

Application Metrics


Total Monthly Logins36,275
Total Number of Courses9748
Total Number of Active Courses2017

LearnUCS Mobile Statistics for 6 December 2014 to 5th January 2015

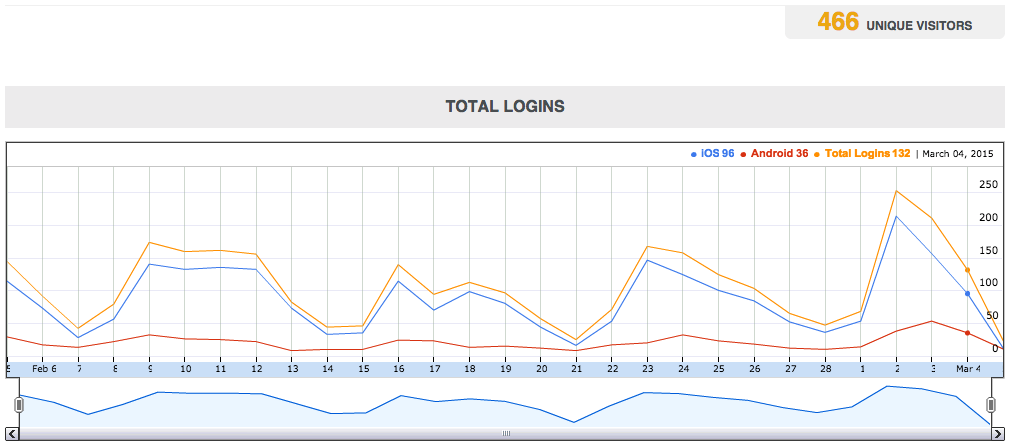
Total unique logins for the period was 466 with 3,144 logins.  This shows another significant rise in the use of the mobile app.  This may be to do with our new Blackboard License that includes the mobile app as a free download for users.

iOS is still the most popular operating system for those devices.


It will be interesting to compare these with the next set of statistics to see if there is continued growth.

Thursday, 5 February 2015

LearnUCS Stats: January 2015

Application Insight

Below is the continuation of the publishing of monthly statistics for LearnUCS.  These stats cover the period from January 6th 2015 to February 5th 2015.

As mentioned last month, December is always a quieter month, due to the end of semester and the festive break.  Having said that, December 2014 was the busiest month for LearnUCS since we moved to a managed hosted system.

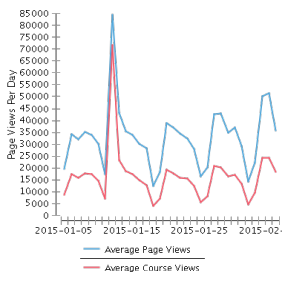
The stats set out below show a large jump from December as you would expect, but these are higher than we would have thought, especially the large spike on January 12th.  This spike is currently being investigated with the Academic Services team to see if it fits with the first day of a new intake and/or submission period.


Total Page Views1,593,635
Average Page Views Per DayNon course - 32,826

Course - 16,768
Most Active DateNon Course - 84,323- 12 January 2015

Course - 71,417 - 12 January 2015


Applications Metrics


Total Monthly Logins37,373
Total Number of Courses9718
Total Number of Active Courses2129

Our active course count has risen dramatically this month, by almost a quarter, this is due to the start of semester 2 and those module areas being unavailable until the lecturers are ready to release them.

LearnUCS Mobile Statistics for 6 January 2015 to 5th February 2015

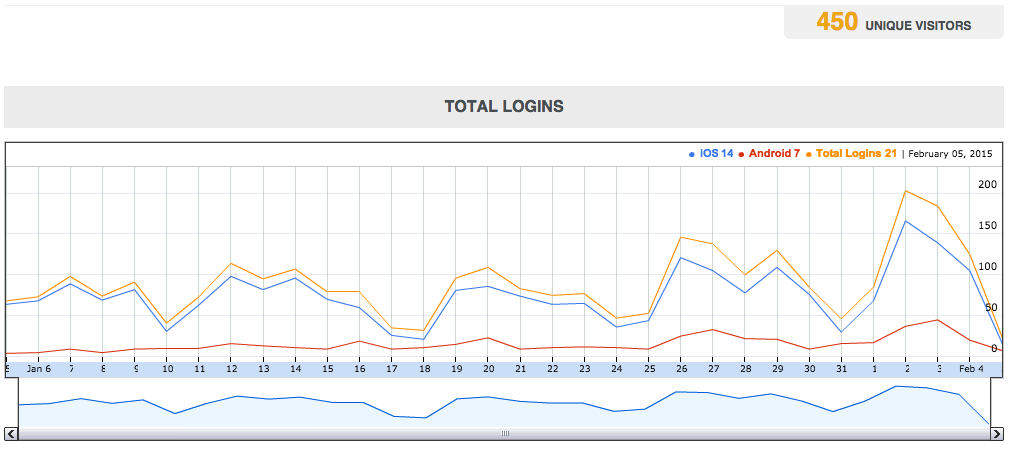
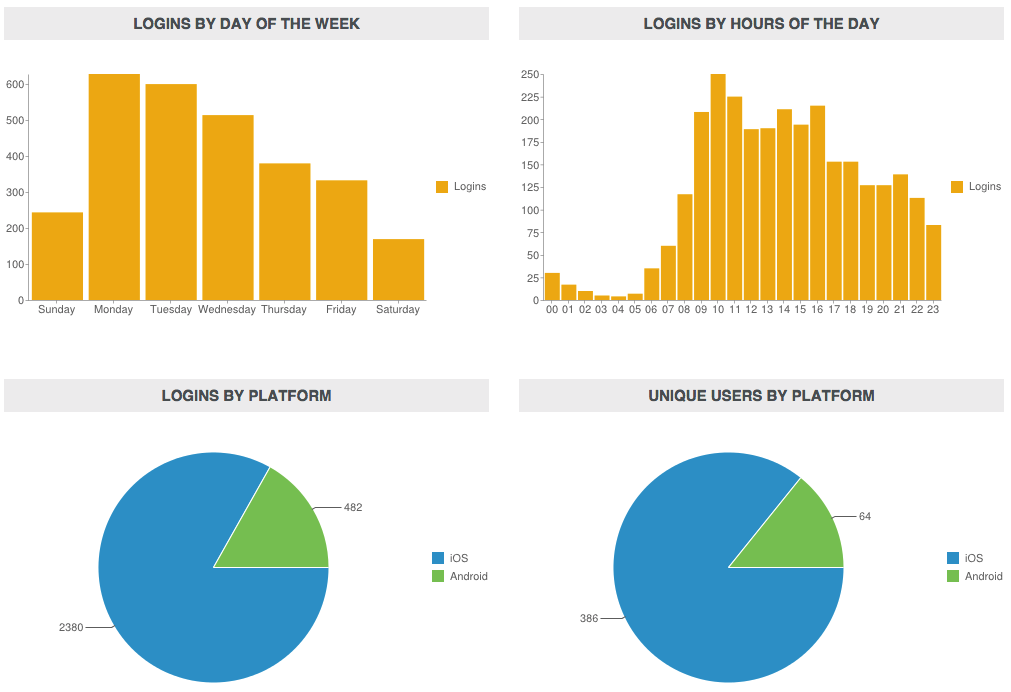
Total unique logins for the period was 450 which is over 100 more than last month, with 2862 logins by those 450 users.  That number of logins is almost double that of the previous month.

iOS is still the most popular operating system for those devices by far with 386 of the 450 being on iOS.


It will be interesting to compare these with the next set of statistics to see if there is continued growth.


Monday, 5 January 2015

LearnUCS December 2014 Stats

Application Insight


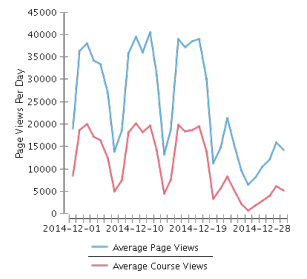
Below you will find the monthly stats for December 2014.  December is always one of those months that sits towards the bottom of a trough with regard to the numbers.

December is a month where we hit the end of a semester as well as have a two week break for the festive season.  Having said that, this months statistics are the best for any December since we moved to a managed hosted system in 2012.

Total Page Views
1,102,075
Average Page Views Per Day
Non course - 24,665
Course - 11,084
Most Active Date
Non Course - 40,531- 12 December 2014
Course - 24,446 - 12 December 2014


Application Metrics


Total Monthly Logins
32,310
Total Number of Courses
9710
Total Number of Active Courses
1714


With regard to the large difference between total number of courses and total number of active courses, we still have a large number of legacy courses that were migrated across from our self-hosted system that need to be manually disabled and removed.

LearnUCS Mobile Statistics for 6 December 2014 to 5th January 2015


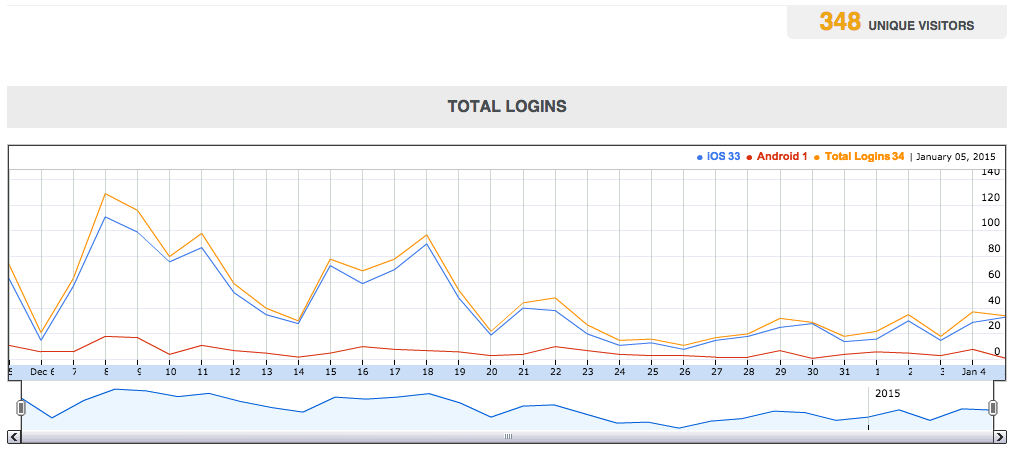
Total unique logins for the period was 348 with 1,531 logins by those 348 users.


iOS is still the most popular operating system for those devices by far with 301 of the 348 being on iOS, that is just over 86%.


This statistics post will become a regular feature on the blog, look out for January's numbers next month.

Tuesday, 13 November 2012

LearnUCS - The Numbers - Part 2

This update is a little later than planned, due partly to last weeks Development Sprint.  It is interesting to see how the numbers add up now we are into the second month of LearnUCS.

LearnUCS Statistics for October 2012


Application Insight

(Course views are all pages within a course, non course page views are pages outside of courses, such as the LearnUCS home page, announcements page)

We can see below that compared to September's stats, usage has grown quickly.  Page Views in and out of courses has almost doubled as has the number of logins.  Although active courses has dropped, we will need to look at why this is.  Is it due to student logging in, see what is or is available and then not accessing that area again, or is it something else?


Total Monthly Logins47.438
Total Page Views2,090,875
Average Page Views Per DayNon course - 51,225
Course - 18,470
Most Active DateNon Course - 74,594 - 17 October 2012
Course - 31,287 - 17 October 2012
Total Number of Courses5987 (including historical courses form 10/11 and 11/12)
Total Number of Active Courses1660


 October Stats


Mobile LearnUCS Statistics for 13th October 2012 to 13th November 2012

The mobile app was only released on an end user licence basis in mid September, this allows students and staff to use the mobile app even though UCS doesn’t licence the service directly.  Users are now able to download and pay a small fee to use the application themselves.


Total unqiue logins for the period was 203.


The iOS platform is still the most use mobile operating system.


Mobile App Usage


Mobile App Usage


It will be very interesting to see how the numbers add up next month.